


 6 / 9
6 / 9

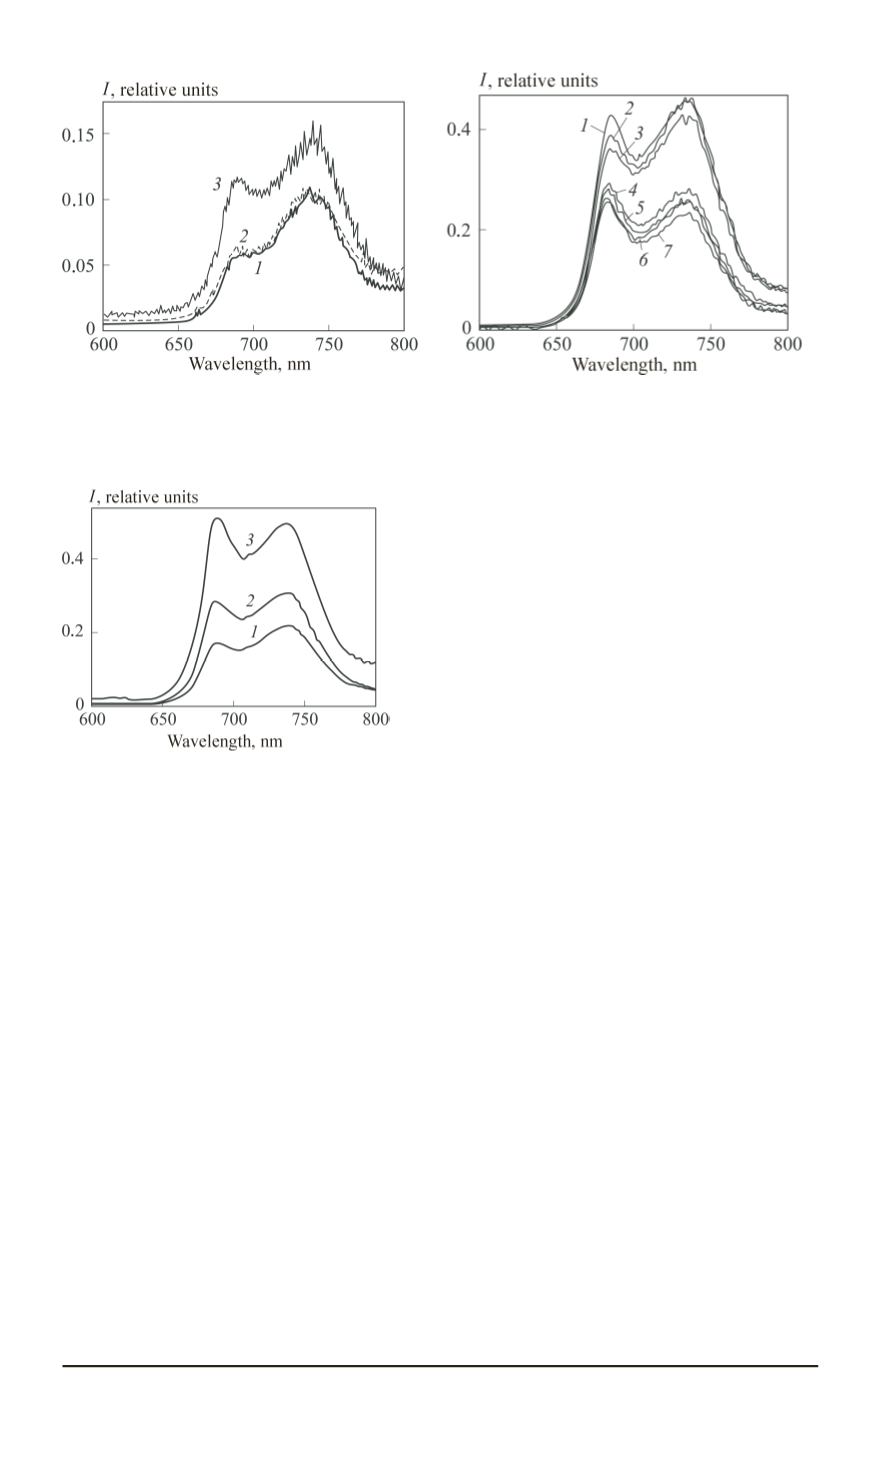
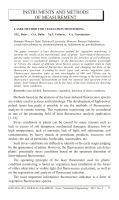
Fig. 3. The fluorescence spectra of grass
under stress caused by introduction of
copper sulfate to the soil
Fig. 4. The fluorescence spectra of
watercress under stress caused by
mechanical damage to plant
Рис. 5. The fluorescence spectra of
watercress under stress caused by
excess watering
Fig. 4 clearly shows that the
influence of the stress factors (in this
case caused by the mechanical damage)
can manifest itself in changing the form
of the fluorescence spectrum. The ratio
of fluorescence intensities
R
680
/
740
at
wavelengths of 680 and 740 nm for
the plant under stress is greater than
unity, and the value of
R
680
/
740
for the
plant in the normal state is less than
unity. The fluorescence level of the plant
under stress even slightly less than the
fluorescence level of the plant in a good
condition.
Experts in plant physiology associate the effect of changing the form
of the fluorescence spectrum of plants under stress with fluctuations in
the activity of photosystem II, which result in changing the ratio of the
fluorescence intensities in both the red (680 nm) and far-red (740 nm)
regions [25].
Fig. 5 illustrates another possible kind of change in the fluorescence
spectrum of the stressed plant.
Fig. 5 shows the spectra of laser-induced fluorescence of watercress
in the normal (curve
1
) and stressed (curve
3
) conditions caused by
excess plant watering. Curve
3
corresponds to the average (using different
samples) fluorescence spectrum under excess irrigation for 24 days. Curve
2
shows an intermediate change of the condition (between the exactly normal
and the exactly stressed) and corresponds to the averaged (using different
samples) fluorescence spectrum under excess irrigation for 17 days.
76 ISSN 0236-3933. HERALD of the BMSTU. Series “Instrument Engineering”. 2015. No. 2